

Courses tagged with "Web Design" (6)
In this course, you will look at the properties behind the basic concepts of probability and statistics and focus on applications of statistical knowledge. You will learn about how statistics and probability work together. The subject of statistics involves the study of methods for collecting, summarizing, and interpreting data. Statistics formalizes the process of making decisions, and this course is designed to help you use statistical literacy to make better decisions. Note that this course has applications for the natural sciences, economics, computer science, finance, psychology, sociology, criminology, and many other fields. We read data in articles and reports every day. After finishing this course, you should be comfortable evaluating an author's use of data. You will be able to extract information from articles and display that information effectively. You will also be able to understand the basics of how to draw statistical conclusions. This course will begin with descriptive statistic…
If you invest in financial markets, you may want to predict the price of a stock in six months from now on the basis of company performance measures and other economic factors. As a college student, you may be interested in knowing the dependence of the mean starting salary of a college graduate, based on your GPA. These are just some examples that highlight how statistics are used in our modern society. To figure out the desired information for each example, you need data to analyze. The purpose of this course is to introduce you to the subject of statistics as a science of data. There is data abound in this information age; how to extract useful knowledge and gain a sound understanding in complex data sets has been more of a challenge. In this course, we will focus on the fundamentals of statistics, which may be broadly described as the techniques to collect, clarify, summarize, organize, analyze, and interpret numerical information. This course will begin with a brief overview of the discipline of stat…

Why write programs when the computer can instead learn them from data? In this class you will learn how to make this happen, from the simplest machine learning algorithms to quite sophisticated ones. Enjoy!
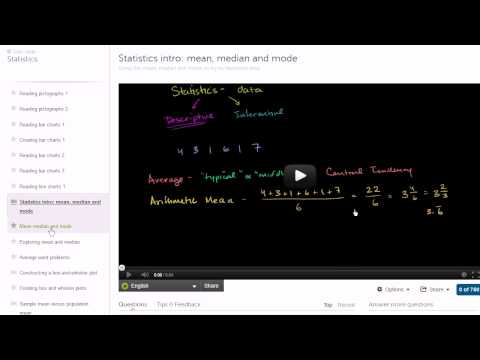
Introduction to statistics. We start with the basics of reading and interpretting data and then build into descriptive and inferential statistics that are typically covered in an introductory course on the subject. Overview of Khan Academy statistics. Statistics intro: mean, median and mode. Constructing a box-and-whisker plot. Sample mean versus population mean.. Variance of a population. Sample variance. Review and intuition why we divide by n-1 for the unbiased sample variance. Simulation showing bias in sample variance. Simulation providing evidence that (n-1) gives us unbiased estimate. Statistics: Standard Deviation. Statistics: Alternate Variance Formulas. Introduction to Random Variables. Probability Density Functions. Binomial Distribution 1. Binomial Distribution 2. Binomial Distribution 3. Binomial Distribution 4. Expected Value: E(X). Expected Value of Binomial Distribution. Poisson Process 1. Poisson Process 2. Introduction to the Normal Distribution. Normal Distribution Excel Exercise. Law of Large Numbers. ck12.org Normal Distribution Problems: Qualitative sense of normal distributions. ck12.org Normal Distribution Problems: Empirical Rule. ck12.org Normal Distribution Problems: z-score. ck12.org Exercise: Standard Normal Distribution and the Empirical Rule. ck12.org: More Empirical Rule and Z-score practice. Central Limit Theorem. Sampling Distribution of the Sample Mean. Sampling Distribution of the Sample Mean 2. Standard Error of the Mean. Sampling Distribution Example Problem. Confidence Interval 1. Confidence Interval Example. Mean and Variance of Bernoulli Distribution Example. Bernoulli Distribution Mean and Variance Formulas. Margin of Error 1. Margin of Error 2. Small Sample Size Confidence Intervals. Hypothesis Testing and P-values. One-Tailed and Two-Tailed Tests. Z-statistics vs. T-statistics. Type 1 Errors. Small Sample Hypothesis Test. T-Statistic Confidence Interval. Large Sample Proportion Hypothesis Testing. Variance of Differences of Random Variables. Difference of Sample Means Distribution. Confidence Interval of Difference of Means. Clarification of Confidence Interval of Difference of Means. Hypothesis Test for Difference of Means. Comparing Population Proportions 1. Comparing Population Proportions 2. Hypothesis Test Comparing Population Proportions. Squared Error of Regression Line. Proof (Part 1) Minimizing Squared Error to Regression Line. Proof Part 2 Minimizing Squared Error to Line. Proof (Part 3) Minimizing Squared Error to Regression Line. Proof (Part 4) Minimizing Squared Error to Regression Line. Regression Line Example. Second Regression Example. R-Squared or Coefficient of Determination. Calculating R-Squared. Covariance and the Regression Line. Correlation and Causality. Chi-Square Distribution Introduction. Pearson's Chi Square Test (Goodness of Fit). Contingency Table Chi-Square Test. ANOVA 1 - Calculating SST (Total Sum of Squares). ANOVA 2 - Calculating SSW and SSB (Total Sum of Squares Within and Between).avi. ANOVA 3 -Hypothesis Test with F-Statistic. Another simulation giving evidence that (n-1) gives us an unbiased estimate of variance. Mean Median and Mode. Range and Mid-range. Reading Pictographs. Reading Bar Graphs. Reading Line Graphs. Reading Pie Graphs (Circle Graphs). Misleading Line Graphs. Stem-and-leaf Plots. Box-and-Whisker Plots. Reading Box-and-Whisker Plots. Statistics: The Average. Statistics: Variance of a Population. Statistics: Sample Variance. Deductive Reasoning 1. Deductive Reasoning 2. Deductive Reasoning 3. Inductive Reasoning 1. Inductive Reasoning 2. Inductive Reasoning 3. Inductive Patterns.

Introduction to statistics. Will eventually cover all of the major topics in a first-year statistics course.

We live in a time of unprecedented access to information. You'll learn how to use statistics to interpret that information and make decisions. San Jose State University
Add to calendar

Trusted paper writing service WriteMyPaper.Today will write the papers of any difficulty.