

Courses tagged with "Web Design" (101)
Learn about the most effective machine learning techniques, and gain practice implementing them and getting them to work for yourself.
Statistics One is a comprehensive yet friendly introduction to statistics.

Learn about the most effective data analysis methods to solve problems and achieve insight.

This course is about learning the fundamental computing skills necessary for effective data analysis. You will learn to program in R and to use R for reading data, writing functions, making informative graphs, and applying modern statistical methods.

This class presents the fundamental probability and statistical concepts used in elementary data analysis. It will be taught at an introductory level for students with junior or senior college-level mathematical training including a working knowledge of calculus. A small amount of linear algebra and programming are useful for the class, but not required.
Learn about artificial neural networks and how they're being used for machine learning, as applied to speech and object recognition, image segmentation, modeling language and human motion, etc. We'll emphasize both the basic algorithms and the practical tricks needed to get them to work well.
Understanding how the brain works is one of the fundamental challenges in science today. This course will introduce you to basic computational techniques for analyzing, modeling, and understanding the behavior of cells and circuits in the brain. You do not need to have any prior background in neuroscience to take this course.
Investigate the flexibility and power of project-oriented computational analysis, and enhance communication of information by creating visual representations of scientific data.
Join the data revolution. Companies are searching for data scientists. This specialized field demands multiple skills not easy to obtain through conventional curricula. Introduce yourself to the basics of data science and leave armed with practical experience extracting value from big data. #uwdatasci

Why write programs when the computer can instead learn them from data? In this class you will learn how to make this happen, from the simplest machine learning algorithms to quite sophisticated ones. Enjoy!

An introduction to data integration and statistical methods used in contemporary Systems Biology, Bioinformatics and Systems Pharmacology research.

With existing data, you will develop skills in data analysis and basic statistics by exploring your own research question.
Learn the concepts and methods of linear algebra, and how to use them to think about computational problems arising in computer science. Coursework includes building on the concepts to write small programs and run them on real data.

This course is an introduction to the theory and practice of financial engineering and risk management. We consider the pricing of derivatives, portfolio optimization and risk management and cast a critical eye on how these are used in practice. We will also feature some interview modules with Emanuel Derman .

Learn critical concepts and practical methods to support research data planning, collection, storage and dissemination.
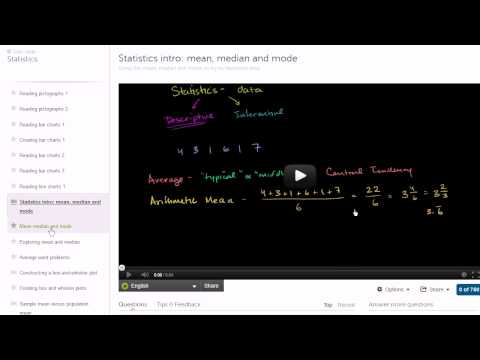
Introduction to statistics. We start with the basics of reading and interpretting data and then build into descriptive and inferential statistics that are typically covered in an introductory course on the subject. Overview of Khan Academy statistics. Statistics intro: mean, median and mode. Constructing a box-and-whisker plot. Sample mean versus population mean.. Variance of a population. Sample variance. Review and intuition why we divide by n-1 for the unbiased sample variance. Simulation showing bias in sample variance. Simulation providing evidence that (n-1) gives us unbiased estimate. Statistics: Standard Deviation. Statistics: Alternate Variance Formulas. Introduction to Random Variables. Probability Density Functions. Binomial Distribution 1. Binomial Distribution 2. Binomial Distribution 3. Binomial Distribution 4. Expected Value: E(X). Expected Value of Binomial Distribution. Poisson Process 1. Poisson Process 2. Introduction to the Normal Distribution. Normal Distribution Excel Exercise. Law of Large Numbers. ck12.org Normal Distribution Problems: Qualitative sense of normal distributions. ck12.org Normal Distribution Problems: Empirical Rule. ck12.org Normal Distribution Problems: z-score. ck12.org Exercise: Standard Normal Distribution and the Empirical Rule. ck12.org: More Empirical Rule and Z-score practice. Central Limit Theorem. Sampling Distribution of the Sample Mean. Sampling Distribution of the Sample Mean 2. Standard Error of the Mean. Sampling Distribution Example Problem. Confidence Interval 1. Confidence Interval Example. Mean and Variance of Bernoulli Distribution Example. Bernoulli Distribution Mean and Variance Formulas. Margin of Error 1. Margin of Error 2. Small Sample Size Confidence Intervals. Hypothesis Testing and P-values. One-Tailed and Two-Tailed Tests. Z-statistics vs. T-statistics. Type 1 Errors. Small Sample Hypothesis Test. T-Statistic Confidence Interval. Large Sample Proportion Hypothesis Testing. Variance of Differences of Random Variables. Difference of Sample Means Distribution. Confidence Interval of Difference of Means. Clarification of Confidence Interval of Difference of Means. Hypothesis Test for Difference of Means. Comparing Population Proportions 1. Comparing Population Proportions 2. Hypothesis Test Comparing Population Proportions. Squared Error of Regression Line. Proof (Part 1) Minimizing Squared Error to Regression Line. Proof Part 2 Minimizing Squared Error to Line. Proof (Part 3) Minimizing Squared Error to Regression Line. Proof (Part 4) Minimizing Squared Error to Regression Line. Regression Line Example. Second Regression Example. R-Squared or Coefficient of Determination. Calculating R-Squared. Covariance and the Regression Line. Correlation and Causality. Chi-Square Distribution Introduction. Pearson's Chi Square Test (Goodness of Fit). Contingency Table Chi-Square Test. ANOVA 1 - Calculating SST (Total Sum of Squares). ANOVA 2 - Calculating SSW and SSB (Total Sum of Squares Within and Between).avi. ANOVA 3 -Hypothesis Test with F-Statistic. Another simulation giving evidence that (n-1) gives us an unbiased estimate of variance. Mean Median and Mode. Range and Mid-range. Reading Pictographs. Reading Bar Graphs. Reading Line Graphs. Reading Pie Graphs (Circle Graphs). Misleading Line Graphs. Stem-and-leaf Plots. Box-and-Whisker Plots. Reading Box-and-Whisker Plots. Statistics: The Average. Statistics: Variance of a Population. Statistics: Sample Variance. Deductive Reasoning 1. Deductive Reasoning 2. Deductive Reasoning 3. Inductive Reasoning 1. Inductive Reasoning 2. Inductive Reasoning 3. Inductive Patterns.

Introduction to statistics. Will eventually cover all of the major topics in a first-year statistics course.

Exploratory and objective data analysis methods applied to the physical, engineering, and biological sciences.
Learn the engineering skills needed to build a technology startup from the ground up.

We live in a time of unprecedented access to information. You'll learn how to use statistics to interpret that information and make decisions. San Jose State University
Add to calendar

Trusted paper writing service WriteMyPaper.Today will write the papers of any difficulty.